Power Map for Excel
A new class of tools for the data inclined
My Role
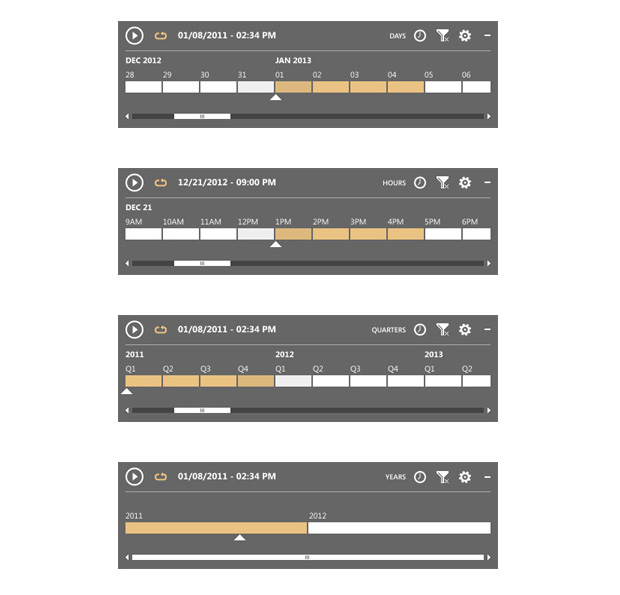
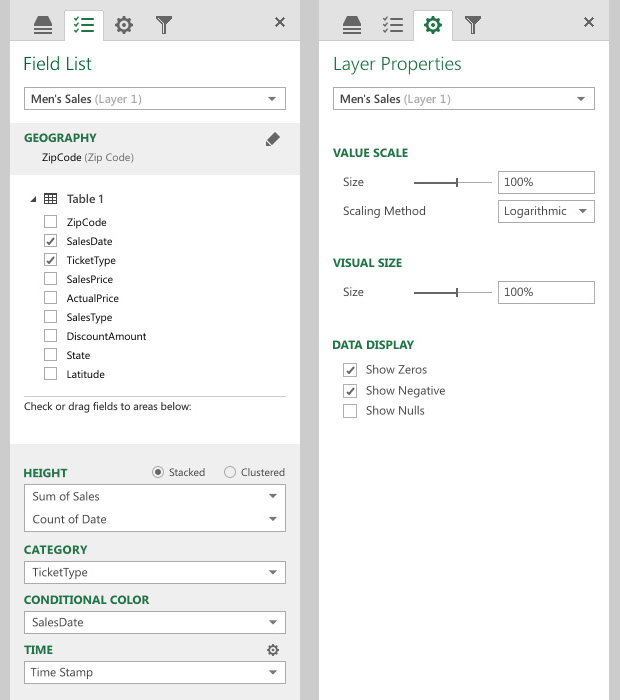
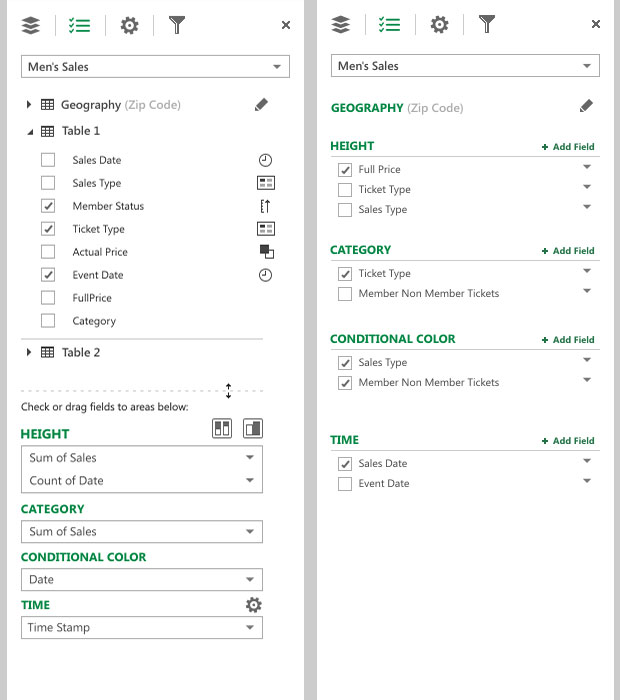
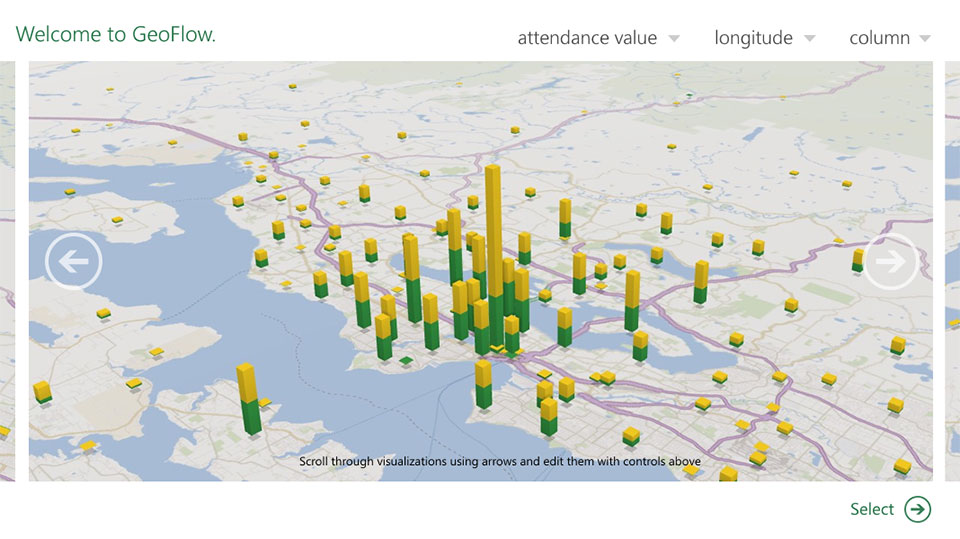
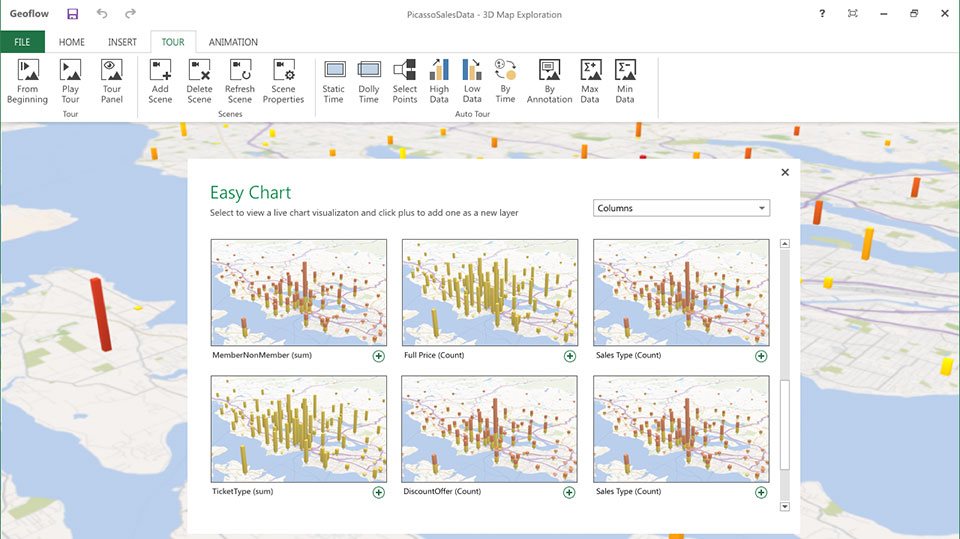
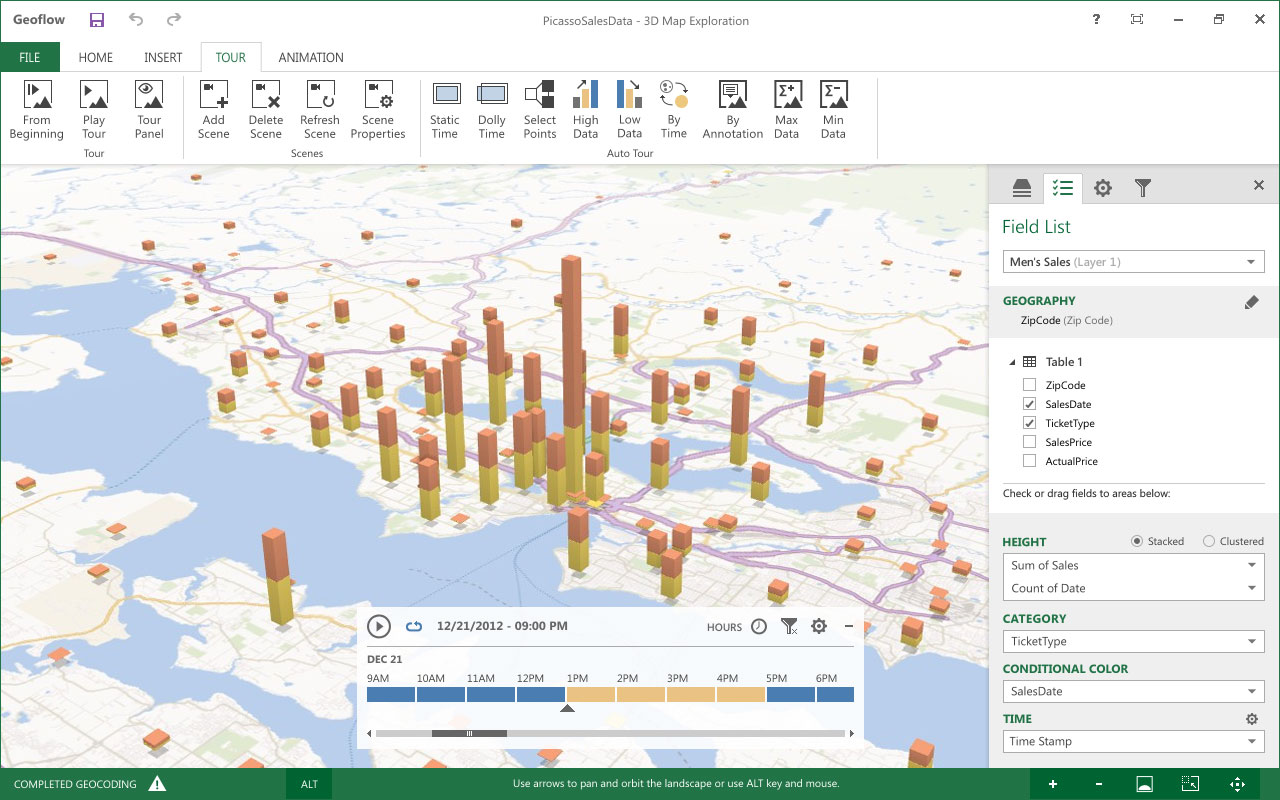
When I joined the team in 2012, the UX/UI was relatively non-existent. Much like it predecessor, Worldwide Telescope, it was only fit for advanced users. Power Map is a powerful 3D data visualization tool for Excel that provides an immersive experience for making discoveries in data that might never be seen in traditional 2D tables and charts.
At the outset, I gathered up functional needs for the various features from the program managers and began to develop early wires and sketches for necessary interactions and UI elements. I also worked with a user researcher to build, test and iterate on common user interactions with potential users. The work shown influenced the UI, but much was not translated directly or utilized as the goals and needs of the project shifted after my I left the team.
Power Map was released in 2013 to the general public as a free add-on to Excel. It has helped give users a different dimension in which to view what normally is a flat sheets of numbers.
Results
Power Map for Excel is available today to use as a free add-on for Excel. It's still evolving as a product and I'm excited to see where it goes next.